
Executive Summary
The analysis and modelling of the volatility of stock markets is of critical importance for option pricing and risk management in different financial markets around the world today. The volatility of the UK, US and Japanese markets are chosen for investigation and an application within the Black and Scholes option pricing framework discussed. This proposal gives an outline of the literature, methodology and data to be used and an outline of the project structure.
1. Introduction
The international stock markets are constantly changing over time and the analysis and modelling of the volatility of these markets is one of the most important factors in option trading and risk management. Over the last thirty years there have been major changes in the financial markets. Examples include the US stock market collapse in October, 1987 and the Japanese stock market (Nikkei-225) crash towards the end of 1989 which resulted within three years that the stock index had lost more than 50% of its value. Other big financial crises include the collapse of Long Term Capital Management and the decline on the NASDAQ in early 2000 of internet, technology and new economy stocks. These changes make volatility modelling a difficult task for academicians and practitioners.
The correct volatility input in option pricing has an important influence in obtaining the correct option premium using the path breaking work of Black and Scholes (1973) and Merton (1973). Sundaresan (2000) provides a major review of continuous time models in finance and their many applications. The use of volatility analysis is also important in the computation in Value-at-Risk (VaR). VaR is mainly concerned with market risk. It is a single estimate of the amount by which an institution’s position in a risk category could decline due to general market movements during a holding period. General discussion on VaR is given in Duffie and Pan (1997) and Jorion (2006).
A number of models have been developed for modelling and forecasting volatility and a major review of econometric volatility models is given in Poon and Granger (2003). We will investigate the use of these models using the FTSE-100 stock market index for the UK, S&P 500 stock market index for the US and the Nikkei-225 for Japan.
This proposal is organized as follows: Section 2 provides a literature review of volatility models and Section 3 discusses the daily data to be used on the different stock markets. Section 4 outlines the methodology of the project and Section 5 presents the chapter headings and subheadings. Conclusions are given in Section 6.
2. Literature Review
The first seminal paper on volatility was by Engle (1982) who proposed the ARCH (AutoRegressive Conditional Heteroscedasticity) model. That model was used to capture volatility persistence in inflation. The model has had extensive application in finance to different series and reviews are given in Bollerslev, Chou, and Kroner (1992), Poon and Grnager (2003, 2005) and Poon (2005). Bollerslev, Chou, and Kroner (1992) provide an excellent early review of theory and ten years of empirical evidence for financial markets covering equities, foreign exchange and interest rates. An important extension to the ARCH model is the GARCH (generalized ARCH) model due to Bollerslev (1986) and Taylor (1986). This model is a more parsimonious model of volatility where additional lagged dependencies are permitted on past variances.
The GARCH model is related to the Exponentially Weighted Moving Average (EWMA) model used in Riskmetrics to obtain VaR computations. The exponential GARCH model denoted EGARCH is due to Nelson (1991). The specification uses the conditional variance in logarithmic form which means that there is no need to impose an estimation constraint in order to avoid negative variance. The specification captures the stylized facts that a negative shock leads to a higher conditional variance in the subsequent period than a positive shock. Other popular models in the literature include the GJR-GARCH model of Glosten, Jagannathan and Runkle (1993) and the threshold GARCH model (TGARCH) of Zakoian (1994). Examples of empirical applications of using EGARCH models include: Cao and Tsay (1992), Heynen and Kat (1994), Lee (1991) and Pagan and Schwert (1990). Brailsford and Faff (1996) and Taylor (2004) find GJR-GARCH outperforms GARCH in stock indices.
3. Data Collection Method
The data to be used in the study is daily stock market index data for the following indices: FTSE-100, S&P 500 and the Nikkei-225 covering the sample period from January 1st, 1990 to December 1st, 1999 and is based on closing prices at the exchanges. We use logarithmic returns calculated from the series to produce the returns. As an example, inspecting the return series for the UK market as depicted in Figure 1 below reveals that volatility is not constant over time and moreover tends to cluster. Periods of high volatility can be distinguished from low volatility periods. Various summary statistics and graphs of distributions will be used for the different markets to highlight different characteristics and trends over the sample period.
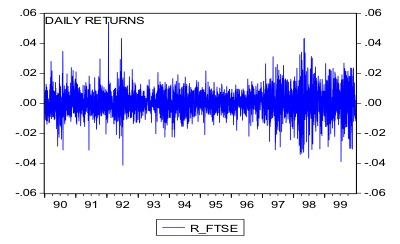
Figure 1
4. Methodology of the Study
In this section we discuss the formal specification of the econometric volatility models to be used in the project and the option pricing techniques. The first model to be used for returns, , is the ARCH model specified below.
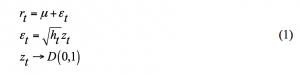
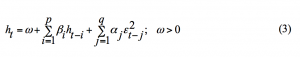
where the constant term is represented by and the distribution is often taken as normal. The process is scaled by , the conditional variance, which in turn is a function of past squared residual returns. The ARCH (q) process proposed by Engle (1982) is represented below,
![]()
where the conditions are used to ensure is a strictly positive variance. Typically, q is of high order because of the phenomenon of volatility persistence in financial markets and this has been one of the problems with this type of model empirically. Another problem with this model is that the constraints have tended to be violated in practice leading to negative variance.
The GARCH (p,q) of Bollerslev (1986) where additional dependencies are permitted on p lags of past overcomes some of the problems of the ARCH specification and is a more parsimonious formulation of the volatility function. This is given below:
The exponential volatility model of Nelson (1991) is also used in the project. The EGARCH (p,q) specifies the conditional variance in logarithmic form given below:
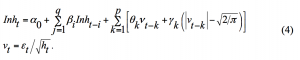
The size of depends on both the size and the sign of . In the original formulation Nelson (1991) assumed a Generalised Error Distribution (GED) structure for the errors. GD is a broad family of distribution but tends to be more difficult to use in practice. We will therefore use the normal distribution.
Estimation of the volatility models will be carried out using the EVIEWS econometrics package. We will use the econometric technique of maximum likelihood to estimate the different models. Essentially the method works by finding the most likely values of the parameters given the actual data. More specifically, the log-likelihood is formed and the values of the parameters that maximise it are sought. Maximum likelihood estimation can be employed to find parameter values for both linear and non-linear models. Another aspect to be investigated is the New Impact Curve which is a representation of the degree of asymmetry of volatility to positive and negative shocks as was developed by Pagan and Schwert (1990).
We will investigate the use of these volatility models in forecasting volatility over specific time periods for the pricing of financial options on the indices where volatility is an input to the pricing model. Stock index options are of the European or the American type and often involve cash settlement procedure upon exercise. These stock index options are traded on the major indices around the world. Options on the spot index are cash-settled and there is no physical delivery of the underlying index, i.e. of a weighted average of prices of the stocks that constitutes the index.
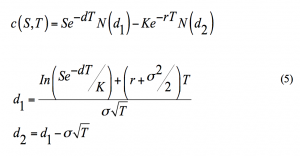
The value of a plan vanilla call option is a function of the current value of the underlying, the strike price, the time to maturity, the risk free interest rate and volatility. When the option underlying index is constructed to pay continuous dividends, the index price is adjusted by the discounted value of the continuous dividend yield.
The adjusted Black and Scholes model when the continuous dividend yield is corresponds to the following formula for the European index call where the standard notation is used in the formulation below (see for example, Briys, Bellalah, Mai and Varenne (1998)):
5. Structure of the Dissertation
In this section we outline the project structure with the main chapter headings and sub-section headings below. The project will be structured as follows:
Title of Project
Executive Summary
Contents Page
Chapter 1: Introduction to Stock Markets and Volatility
1.0 Introduction
1.1 Why Model Volatility
1.2 UK Stock Market
1.3 US Stock Market
1.4 Japanese Stock Market
1.5 Other International Stock Markets
1.6 Volatility Models
1.7 Outline of Project
1.8 Conclusions
Chapter 2: Literature Review on Volatility Models
2.0 Introduction
2.1 General Volatility
2.2 Simple Approaches
2.3 ARCH Model
2.4 GARCH Model
2.5 IGARCH Model
2.6 EGARCH Model
2.7 GJR-GARCH Model
2.8 TGARCH Model
2.9 QGARCH Model
2.10 Multivariate GARCH Models
2.11 Conclusions
Chapter 3: Data
3.0 Introduction
3.1 Data Graphs
3.2 Summary Statistics
3.3 Unit Root Tests
3.4 Distributions
3.5 Conclusions
Chapter 4: Empirical Results
4.0 Introduction
4.1 Estimation Methodology
4.2 Estimation Results
4.3 Applications to Option Pricing
4.4 New Impact Curves
4.5 Conclusions
Chapter 5: Conclusions
Appendices
References
6. Conclusion
In this proposal the analysis and modelling of the volatility of stock markets which is important for option pricing and risk management in different financial markets has been discussed. The volatility of the US, UK and Japanese stock markets are chosen for investigation and an application within the Black and Scholes framework discussed. The proposal has also given an outline of the literature, methodology and data to be used and an outline of the project structure. Overall the project will aim to combine the use of advance econometric methods to an application of finance of practical importance for traders today.
References
Black, F. and Scholes, M. (1973). The Pricing of Options and Corporate Liabilities. Journal of Political Economy 81, 637-654.
Bollerslev, T. R. (1986). Generalized Autoregressive Conditional Heteroskedasticity. Journal of Econometrics, 31, 307-328.
Bollerslev, T. R., Chou, R.Y. and Kroner, K. F. (1992). ARCH Modelling in Finance: A Review of Theory and Empirical Evidence. Journal of Econometrics, 52, 5-59.
Brailsford, T. J., and Faff, R. W. (1996). An Evaluation of Volatility Forecasting Techniques. Journal of Banking and Finance, 20, 419-438.
Briys, E., Bellalah, M., Mai,. H. M., and Varenne, F. (1998). Options, Futures and Exotic Derivatives. John Wiley and Sons Ltd, Chichester.
Cao, C. Q. and Tsay, R. S. (1992). Nonlinear Time-Series Analysis of Stock Volatilities. Journal of Applied Econometrics, 1, 165-185.
Duffie, D and Pan, J. (1997). An Overview of Value at Risk, Journal of Derivatives, 7-48.
Engle, R. F. (1982). Autoregressive Conditional Heteroscedasticity with Estimates of the Variance of United Kingdom Inflation. Econometrica, 50, 987-1007.
Glosten, L. R., Jagannathan, R., and Runkkle, D. E. (1993). On the Relation between the Expected Value and the Volatility of the Nominal Excess Return on Socks. Journal of Finance, 48, 1779-1801.
Heynen, R. C and Kat, H. M. (1994). Volatility Prediction: A Comparison of Stochastic Volatility, GARCH(1,1) and EGARCH(1,1) Models. Journal of Derivatives, 2, 50-65.
Jorion, P. (2006). Value at Risk: The New Benchmark for Controlling Market Risk. 3rd Edition, McGraw-Hill Company: Chicago.
Lee, K. Y. (1991). Are the GARCH Models Best in Out-of-Sample Performance?. Economic Letters, 37, 305-308.
Merton, R. C. (1973). Theory of Rational Option Pricing. Bell Journal of Economics 4, 141-183.
Nelson, D. B. (1991). Conditional Heteroskedasticity in Asset Returns: A New Approach. Econometrica, 59, 347-370.
Pagan, A. R. and Schwert, G. W. (1990). Alternative Models for Conditional Models for Conditional Stock Market Volatility. Journal of Econometrics, 45, 267-290.
Poon, S, H and Granger, C. W. J. (2003). Forecasting Financial Market Volatility: A Review, Journal of Economic Literature, 41, 478-539.
Poon, S, H and Granger, C. W. J. (2005). Practical Issues in Forecasting Volatility, Financial Analysts Journal, 61, 45-56.
Poon, S. H. (2005). A Practical Guide to Forecasting Financial Market Volatility, John –Wiley and Sons, Ltd.
Sundaresan, S. M. (2000). Continuous-Time Methods in Finance: A Review and An Assessment. Journal of Finance, 55, 1569-1622.
Taylor, J. W. (2004). Volatility Forecasting with Smooth Transition Exponential Smoothing. International Journal of Forecasting, 20, 273-286.
Taylor, S. J. (1986). Modelling Financial Time Series. John Wiley and Sons Ltd, Chichester.
Zakoian, J. M. (1994). Threshold Heteroskedastic Models. Journal of Economic Dynamics and Control, 18, 931-955.